
Ongoing Onboarding: How Duolingo Introduces New Skills
Continue to Ongoing Onboarding: How Duolingo Introduces New Skills…

Ferris Bueller once said, “Life moves pretty fast. If you don’t stop and look around once in a while, you could miss it.”
It’s true — especially in today’s mobile landscape. Technology changes, new tablets and smartphones enter the market, devices become more affordable, and network speeds increase.
Basic cell phone users continue transitioning to smartphones at a fast pace as a result. And as ownership of smartphones and tablets increases – expectations for mobile-friendly experiences increase as well.
We took a look at some mobile statistics at this time last year and created a series of infographics to help illustrate the importance of mobile devices in our interactive world.
With a year gone by, what are the latest trends in mobile? Lets take a look.
In a recent survey, 85% of users said their mobile devices are a central part of their everyday life. We take our smartphones with us nearly everywhere and we check them frequently. Daily activities include: accessing email, text messaging, searching the Internet, social media, watching videos, getting news alerts, playing games, listening to music, reading, directions, and more.
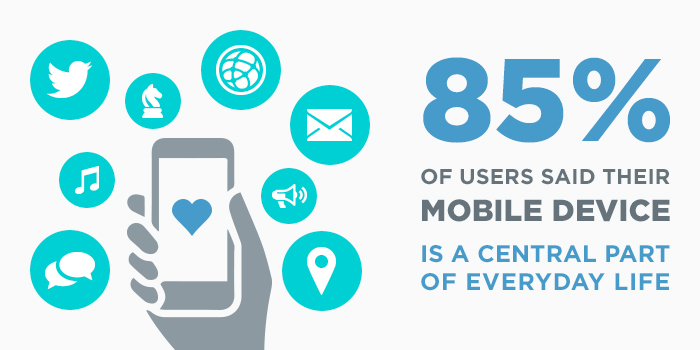
Data Source: ExactTarget
Last year we showed that smartphone ownership had sky rocketed since 2009. That growth pattern continued this past year. Over two-thirds (67%) of mobile subscribers in the U.S. now own a smartphone. Compared to 50% by the end of 2012.
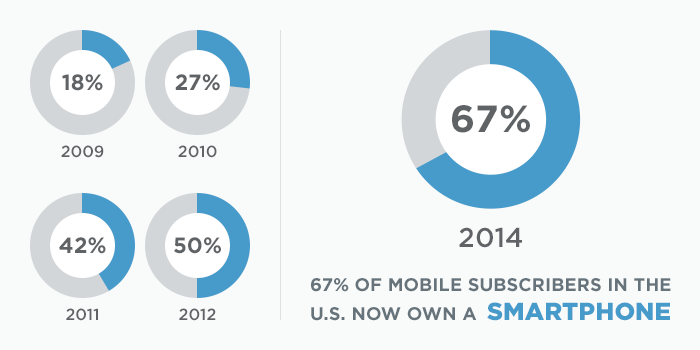
Data Source: Nielsen
Tablets are the fastest-adopted computing device in history. In the U.S., 42% of adults own a tablet device. It took smartphones nearly 5 years to reach an adoption rate of 42%. Tablets achieved that rate in a little over 3 years.
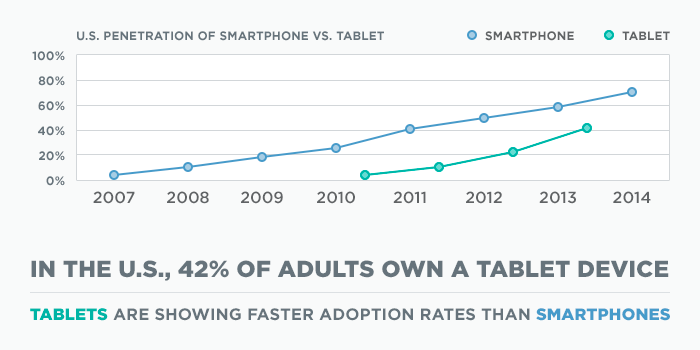
Data Source: Pew Research
Americans spent an average of 34 hours per month using smartphone apps and the mobile web. That is up six hours per month from the previous year. By comparison, the average time spent on the web via computer (PC) was 27 hours per month. Some surveys show mobile time spent to be even higher; as much as 3.3 hours per day.
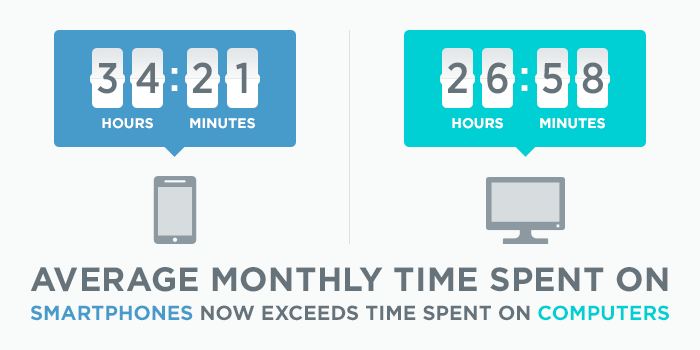
Data Source: Nielsen
When rating mobile experiences, access to content “any way I want” is users’ most important criteria. In fact, 91% of users say access to content any way they want is important to them. In addition, 83% of users say a seamless experience across all their devices is somewhat or very important to them.
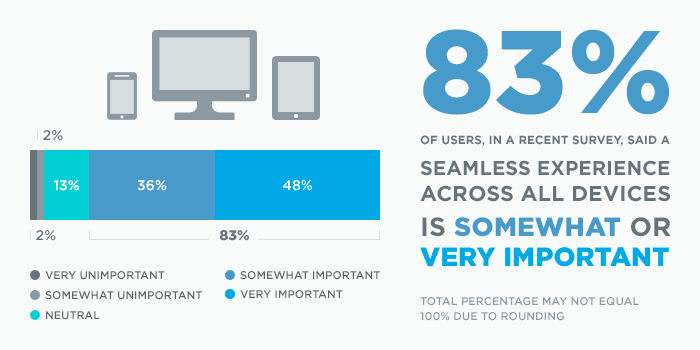
Data Source: ExactTarget
Have you given mobile your full attention? Have you reviewed tablet and smartphone usage metrics lately? Or, most important — have you talked to your users lately regarding their mobile preferences or conducted mobile usability testing?
As more and more users rely on their tablets and smartphones, it may be time to re-evaluate your mobile presence before your users’ expectations pass you by.
If you would like to talk mobile strategies, get in touch. We’d love to discuss how we could collaborate with you.
Continue to Ongoing Onboarding: How Duolingo Introduces New Skills…

